
Key insight - The areas of greatest unmet need for CFSS IFS is most pronounced in the northern and southern suburbs, and some regional areas.
As a result of building the data asset we can now see the level of complexity and need across government regions. This informs our decision-making around service system design and commissioning.
Monitoring service reach across regions
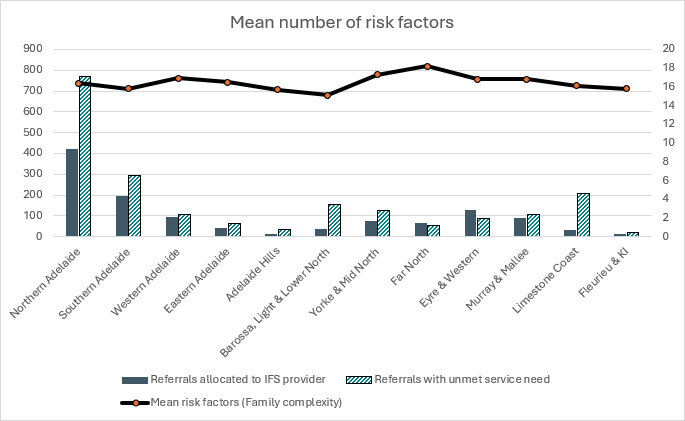
Text description of chart: Monitoring service reach across regions
This chart presents referral data across 13 South Australian regions. It includes two types of referral counts shown as stacked bars, and one line showing the mean number of family‑complexity risk factors for each region.
Region by region summary
Approximate values are described in relative terms because the chart does not present exact numbers.
Northern Adelaide
- Highest referral count of all regions, roughly 1,200 total.
- Large orange portion indicates many referrals with unmet service need.
- Mean risk factors around 16.
Southern Adelaide
- Second‑highest referral volume, roughly 500–600.
- Mix of allocated referrals and unmet need.
- Mean risk factors approximately 15–16.
Western Adelaide
- Moderate referral count, around 250–300.
- Mean risk factors about 15.
Eastern Adelaide
- Referral count around 125.
- Mean risk factors about 15–16.
Adelaide Hills
- Lower referral numbers, under 100.
- Mean risk factors around 15.
Barossa, Light and Lower North
- Low referral numbers, around 150.
- Mean risk factors close to 15.
Yorke and Mid North
- Referral numbers around 150–180.
- Mean risk factors around 16–17.
Far North
- Low referral numbers, around 100.
- Mean risk factors nearing 17.
Eyre and Western
- Referral numbers about 150–200.
- Mean risk factors around 16.
Murray and Mallee
- Referral numbers around 150.
- Mean risk factors around 16.
Limestone Coast
- Referral numbers approximately 250.
- Mean risk factors roughly 16.
Fleurieu and Kangaroo Island
- Very low referral numbers (around 20).
- Mean risk factors around 16.
Key Insights
- Northern Adelaide accounts for the majority of referrals, significantly more than any other region.
- Unmet service need is visibly high in the two urban regions with the highest referrals: Northern and Southern Adelaide.
- Risk factor averages remain relatively consistent across regions, typically between 14 and 18, indicating similar levels of family complexity regardless of referral volume.
Reference list
- CFSS Data (2025), Analysed by EIRD, CFS, DHS, SA Government