
We’re all getting older
This Plan for 2026 to 2036 covers a period in the middle of a significant demographic shift. The 2021 national Census showed the state of South Australia had the second oldest population in the nation, behind Tasmania.
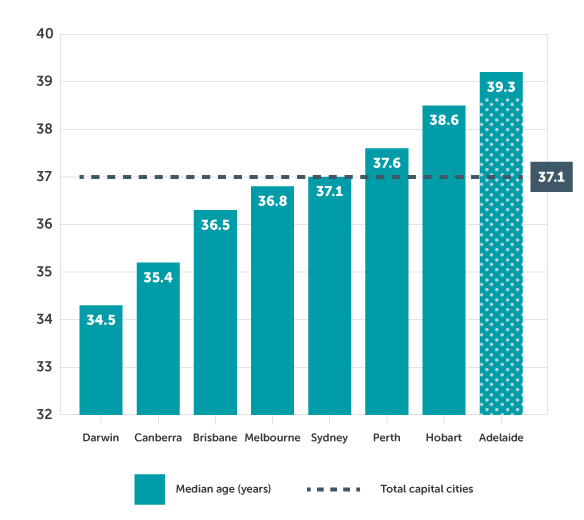
Examining capital cities, Adelaide had a median age of 39.3 while the rest of South Australia had a median age of 47 and communities in the Fleurieu and Yorke Peninsulas had medians of 60 years or above.
Graph 1: Median age by capital city. Source: ABS 2021 Census
The past century saw changes in our community makeup, as the number of people over 65 increased at a greater rate than younger age brackets. These changes accelerated from the 1960s, especially in the number of people aged over 80, which has doubled in number every 20 years. This pattern is expected to accelerate further into the 2040s and South Australia will have the single biggest increase amongst the oldest members of our community in our state’s history.
Graph 2: South Australia’s Ageing Population 1921 to 2041. Source: ABS Census (1921 to 2021)
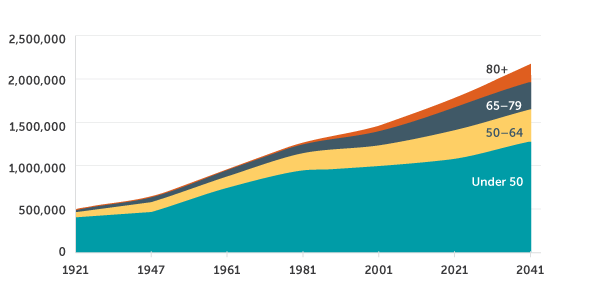
From 2021 to 2041, the state’s total population is expected to increase by around 20%. However, those aged 50 to 64 will reduce as a proportion of the population while those aged over 80 will double again. This shows the beginning of a longer-term change, well beyond the period of this Plan, when the rapid growth of older people will eventually slow. However, we will arrive at a ‘new normal’ with a much higher proportion of older people than at any point in our history.
Data Table: Population growth 2021 to 2041 by age group
Age | Population 2021 | Population 2041 | Change from 2021 to 2041: Number | Change from 2021 to 2041: Percent |
|---|---|---|---|---|
50 to 64 | 343,600 | 370,400 | 26,800 | 7.8 |
65 to 79 | 260,400 | 321,600 | 61,200 | 23.5 |
80+ | 92,00 | 192,700 | 100,700 | 109.5 |
Note: 2041 is a mid-range projection. Figures rounded to the nearest 100.
Our regional and remote areas are ageing faster
The majority (84%) of South Australians live within 100 kilometres of Adelaide, which includes the Barossa Valley, Murray Bridge and the Fleurieu Peninsula. The remaining 16% are located across the remaining 900,000 square kilometres.
While smaller in raw numbers, rural and remote areas have much higher proportions of older people, and this divide is expected to grow. The biggest growth in the total number of older people from 2021 to 2041 will be near Adelaide, but the biggest change in the composition of local communities will happen in regional and remote areas. Almost 1 in 2 people in regional areas will be aged over 50 by 2041.
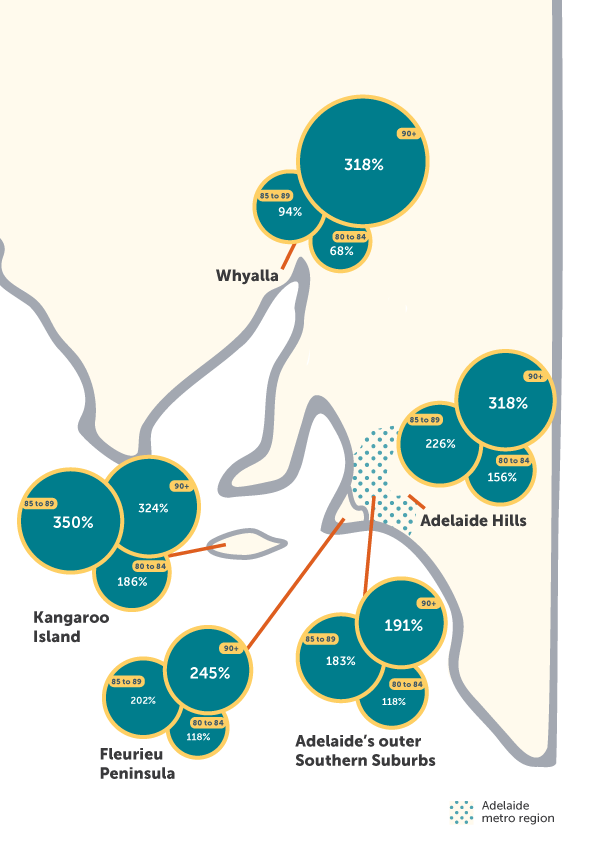
Multiple regions in South Australia expect to see a doubling of people aged 80 to 84, three times as many people aged 85 to 89 and four times as many people aged over 90.
Graph 3: Regional population projections. Source: Plan SA (plan.sa.gov.au)
Overall, the South Australian population is expected to grow 20 per cent from 2021 to 2041.